Category Archives: Calgary SFH

May 2013 Calgary SFH market update

Average and median prices reached an all-time high in May. A dramatic increase in first-time buyers bodes well for the move-up buyer and the long-term health of the market. For the last two days of May, 21% of homes sold for list price or higher, so bidding wars are still going strong. You can see a more comprehensive update on my Monthly stats update.

With inventory approaching the 3500 level, I’m hopeful we’ll see a moderation in prices and an end to the bidding wars for the remainder of the year.

Inventory vs sales and price2

From the Calgary Herald: Calgary housing market smashes records in May

The Economist: “Canadian housing bubble set to burst”

…and here’s a comment from a reader:

‘The problem with all this talk of a “bubble bursting” in the Canadian real estate market is that the Economist have been saying this for many years now. How many years will they keep this up until it actually happens?..’

Read more Canadian housing bubble set to burst

RBC has a completely different take on the situation:

Calgary-area buyers continue to benefit from a strong provincial economy,  accelerating population growth and attractive affordability,” said Craig Wright,  senior vice-president and chief economist, RBC. “RBC (affordability) measures  for Calgary compare favourably against both historical norms and the national  average, keeping it one of the more affordable housing markets in Canada.”

Read more:  Calgary more affordable

Market update May 1 – 19, 2013

The direct relationship between new listings and sales continues to be evident. In short, when there’s nothing to buy, sales suffer. Sales are only up 14% whereas earlier in the month when they were up 22%, but that can be attributed to low inventory and a lack of attractive new listings.

Inventory vs sales and price2

Some meltdown

Douglas Porter, chief economist with BMO Capital Markets, said evidence  continues to mount that the Canadian housing market seems to have pulled off the  fabled soft landing.

He said surprises on the sales data in recent months have consistently been  on the high side of expectations, not the low side.

“While some are highlighting the fact that prices are now rising at ‘their  slowest pace since the 2009 recession’ the plain facts are that: a) they are  still rising, and b) faster than inflation, and c) prices are at all-time highs.  Some meltdown,” he said

Read more in the Herald:  Calgary a bright light among Canadian housing markets.

Image

Market update May 1 – 8, 2013

Inventory vs sales and price2

Inner-city development properties are in demand right now. A tear-down in Capitol Hill which was listed for $475,000 was sold in one day for $535,000.  An old bungalow on a 50′ lot in Banff Trail sold in one day for $549,900 which was list price. It was purchased in 2009 for $470,000. These homes are usually bought by builders who construct 2 infills in place of one old house.

Bidding wars update: Over the past two days, 20% of sales were for list price or higher.

What happened in April

A spike in new listings led to a dramatic rise in first-time buyers in April. Bidding wars are at their highest level in years. Over the past 3 days, 24% of homes sold for list price or higher. With new listings up 5%, I would have expected to see a drop in the median price, but the pent-up demand from buyers kept sales and prices up there. When 24% of homes are selling for list price or higher, you can be assured that inventory levels are not making for a healthy market. Let’s hope for a surge in new listings in May. You can see a more comprehensive update on my Monthly stats update.

Inventory vs sales and price

Market update Apr 1 – 25, 2013

Inventory remains very low for this time of year.

Inventory vs sales and price2

Garth Turner misleads his readers about Calgary

Do not read

Turner said on his GreaterFool.ca blog: It is different in Calgary. It’s worse. Year/year prices are up a startling 9%, but sales have just turned negative compared to last Spring. SFH sales are down 6%, and listings have crashed 22%…The nation’s most American city risks getting a wee taste of Vegas.

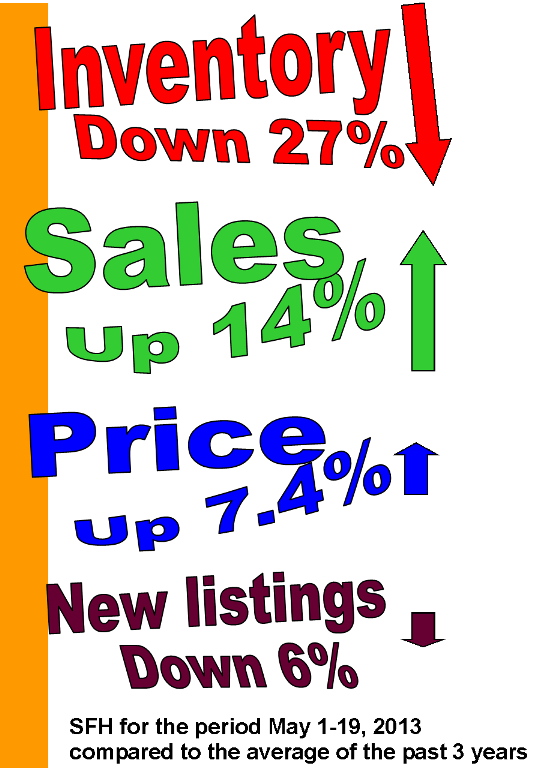
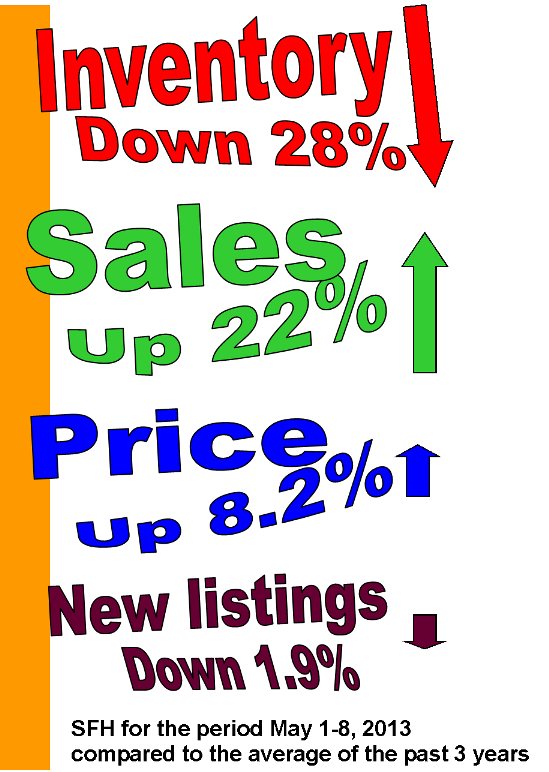
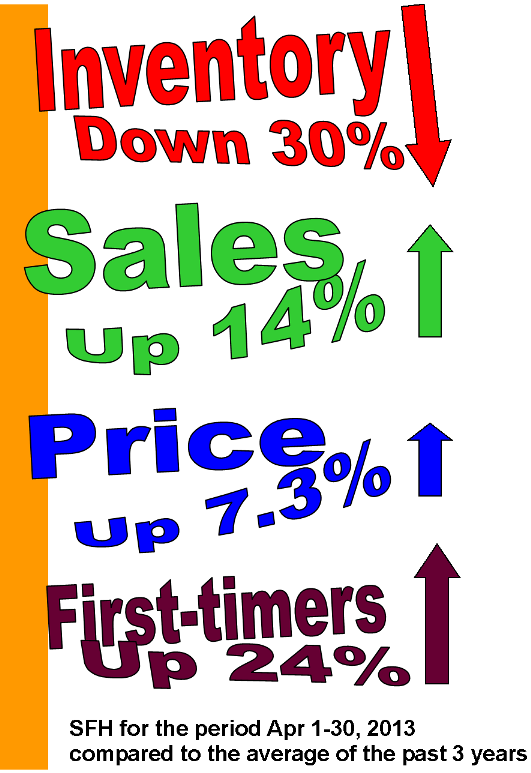
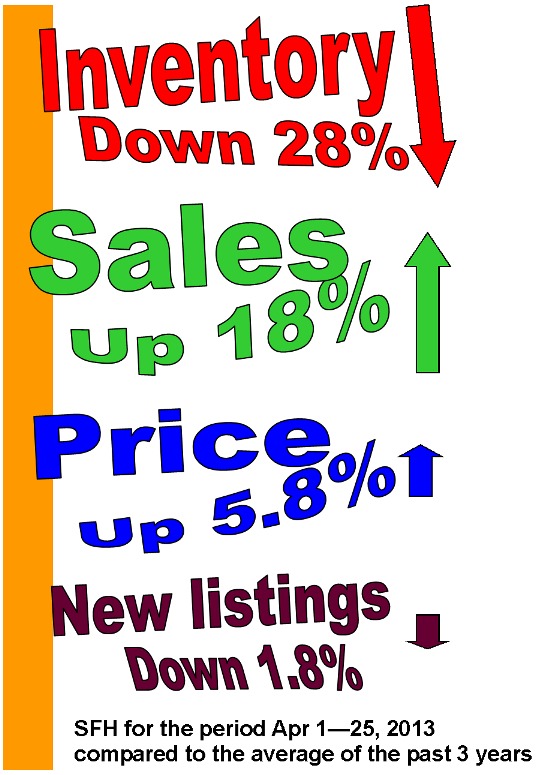
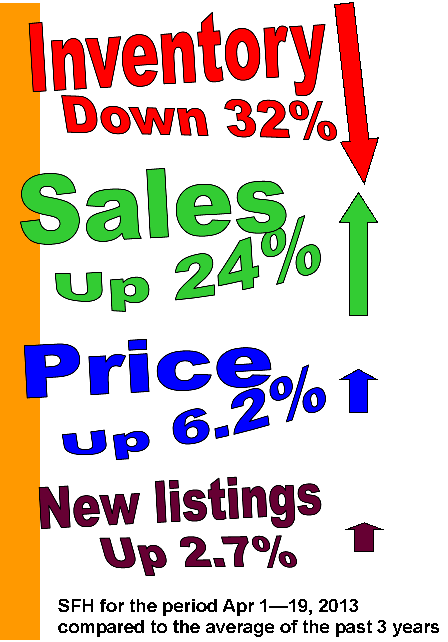
For someone who prides himself on accurate and up-to-date data, this is quite an astonishing deception which he’s trying to pull. How about using data from April? You know, current, updated, relevant numbers?  We know that Gartho has a bookmark to these latest numbers CREB statistics. Sales for the city of Calgary are actually up 14% compared to last year, and new listings have turned the corner this month and are up 13%. It’s no secret that sales have been low because inventory is down 30% compared to historical averages. There just hasn’t been anything to buy.

When you quote statistics that are outdated to prove your point, it makes one wonder if you have an agenda. As it is, GreaterFool.ca seems so intent on having Alberta join the ranks of falling markets in Toronto and Vancouver that he is willing to mislead his readers. Calgary’s stable market has been a source of severe irritation for Turner. Maybe he’s so blinded by his dislike of anything Calgary that he believes his own chicanery and deceptions.

Transparency? Let’s see how forthcoming he is about Calgary’s numbers at the end of the month when sales are up. I predict silence. The greater tragedy, however, is that most of his docile followers don’t even question him.

Market update Apr 1 – 19, 2013

Despite more new listings, inventory continues to drop because of the increased sales.

Inventory vs sales and price2

The demand for homes in Calgary is resulting in numerous bidding wars. Yesterday, 25% of all sales were for list price or higher. A home in Scenic Acres which was listed for $458,000 had an accepted offer after one day on the market and sold for $468,000. It was purchased in 2001 for $209,000.

A tear-down on a 50′ lot in Montgomery also sold in one day. It was listed for $419,000 and sold for $432,500.

2007 is history

Average and median prices in Calgary have been flirting with all-time highs this year. I had a look at the sales history from the past 3 days to see the ultimate fate of those homes sold in 2007 when prices were at their peak.

We’ve had 11 sales where the homes were previously sold in 2007. The average list price was $601,027. The average sale price was $610,136.

7 of the homes sold for more than the previous purchase price in 2007.