Category Archives: Market update

Dramatic change in the market to start 2015

Inventory vs sales and price2

Some welcome changes are occurring in the Calgary housing market. It’s been a long time since buyers had the upper hand, and it’s also been a long time since buyers had a good selection of homes from which to choose.

Bidding wars are almost a thing of the past with only 9% of homes selling for list price or higher in January. It takes about six months for the realities of the market to hit home with most sellers and that’s why you haven’t yet seen a corresponding drop in prices yet.

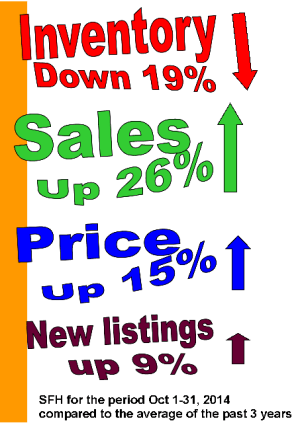
Market update Oct 2014

“Two consecutive years of relatively strong employment and population growth, combined with rising wages and low lending rates, have supported demand growth in our housing sector,” said CREB® chief economist Ann-Marie Lurie.

Inventory vs sales and price2

“All citywide resale segments have recorded a moderate easing of supply constraints, which should help stabilize prices as we approach the end of the calendar year,” said Lurie. “Nonetheless, consumers should be aware that market conditions can vary significantly depending on the location and property type.”

In Oct, 16% of homes sold for list price or higher.

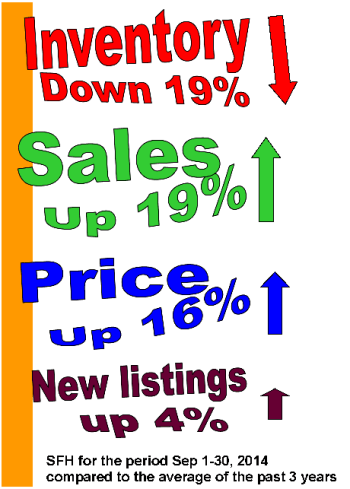
Market update Sep 2014

More home owners have been motivated to list their homes and reap the rewards of the recent price increase. As a result, new listings are up slightly for the sixth consecutive month.

Inventory vs sales and price2

For September, 17% of sales were for list price or higher. If you bought an average house 12 months ago, it has increased in value by $38,750.

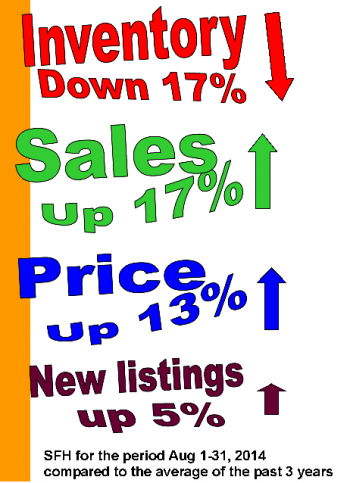
Market update Aug 2014

Calgary continues to experience a shortage of inventory with 17% fewer listings than normal for this time of year. There is only a 60-day supply of single family homes on the market. In the lower price ranges, it’s even more severe. For homes priced under $500,000, there is only a 42-day supply.

Inventory vs sales and price2

Despite the shortage of listings, it was the third-best August ever for SFH sales(second-best for overall sales due to strong condo sales).

If you had any doubts about the lack of inventory, bidding wars are still going strong with 18% of sales for list price or higher.

If you bought an average home in Calgary in Aug 2013, the price has increased $29,100 in the past year.

Market update July 2014

Inventory vs sales and price2
As always in the summer, the price dropped slightly in July. Sales activity is still strong, and more homes are being listed compared to historical averages. Inventory is still low. 19% of homes sold for list price or higher.

If you bought an average home in Calgary in July 2013, the price has increased $29,000 in the past year.

Market update June 30, 2014

Inventory vs sales and price2
Slightly better conditions for buyers in June

  • More homes are being listed
  • Bidding wars have eased, but are still commonplace.
  • 26% of homes sold for list price or higher in June.
  • The average amount paid over list price was $6,417.
  • The median price did not increase
  • Average DOM(days-on-market) increased by 2 days
  • Inventory is almost up to last year’s level
  • The trend is your friend: The sales-to-new-listings trend is decreasing. Last year it was increasing.

If you bought an average home in Calgary in June 2013, the price has increased $40,000 in the past year.

Profit in past year: $37,000

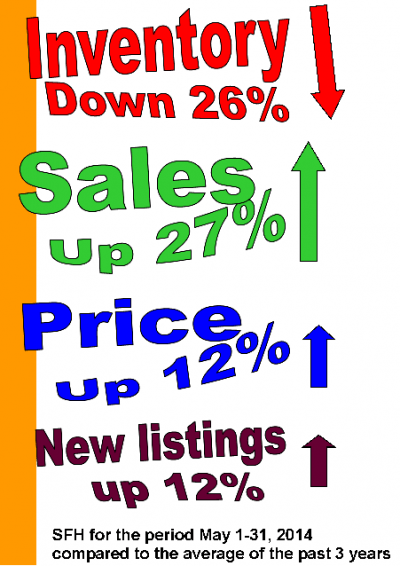
Market update for May 2014

If you bought an average-priced house in May last year, you’ve just made a profit of $37,000. The median price has risen from $453,000 in 2013 to $490,000 today. If you bought at the previous peak in 2007, you’re now up $55,000.

Inventory vs sales and price2

With 31% of homes selling for list price or higher, it’s still a frenzied market for buyers, but a sign of hope: new listings are up by 12%.

For a more detailed summary of the month-end stats , go to my website

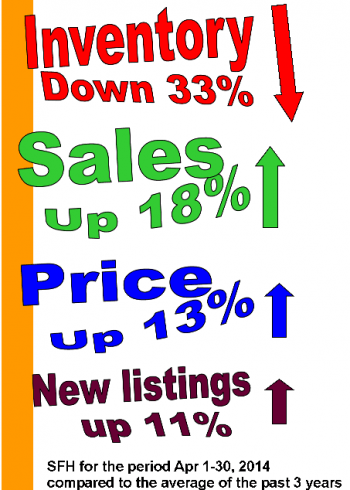
Market update April 30, 2014

Inventory vs sales and price2

A frenzied market continues…

  • 33% of sales were for list price or higher.
  • The only occurrence which has prevented all-out insanity is the fact that new listings are increasing slightly. In the price range below $500,000 homes are selling faster than they’re being listed.  The absorption rate for homes priced between 0 – 500,000 is .8, so that means there is a 24-day supply of listings. In December there was a 36-day supply.
  • 66% of the homes listed last month are already sold.

Suggestion for buyers…

If you’re a buyer, and can wait a few months, there’s bound to be more inventory come July and chances are good that prices will moderate accordingly.

Suggestion for sellers…

There’s never been a better time to get top dollar and a quick sale.

Send me an email if you’d like an evaluation or have any questions bobtruman@shaw.ca

Market update March 31, 2014

Inventory vs sales and price2

My warnings last year of a looming inventory shortage have become reality and it’s an entrenched seller’s market. If you’re looking to sell your home, chances are good that you’ll have a bidding war from prospective buyers. In March, 34% of homes sold for list price or higher. That’s the highest it’s been since the insanity of 2006-2007. Call me for a free evaluation 403-650-2514.

For a more detailed summary of the month-end stats , go to my website

Image

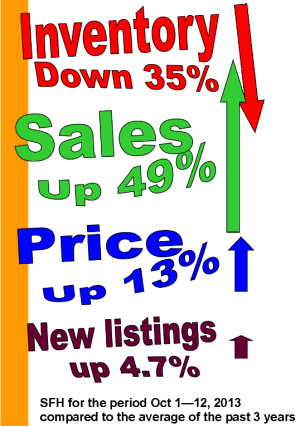
Market update Oct 1 – 12, 2013

Inventory vs sales and price2