Category Archives: Statistics

Why 3 years?

‘The real estate executive says July sales statistics from a historical standard were “tepid” and adds the numbers gets “the big headline” because the comparison is to a period when housing sales were slumping badly.’

http://business.financialpost.com/2013/08/15/canadas-housing-market-the-one-that-no-one-can-predict/

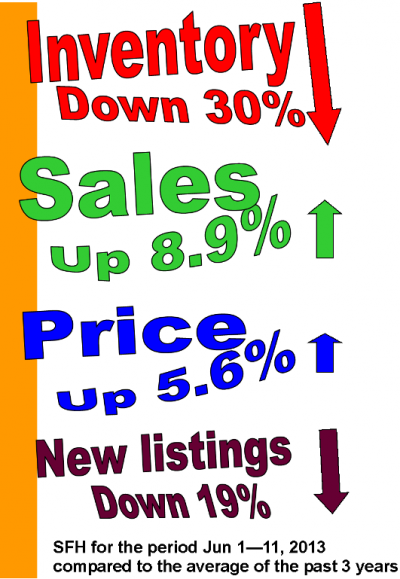
If you’ve followed my blog, you’ll be aware that I’ve been comparing the present year to the average of the past 3 years when I compile the market updates. The story in the Financial Post illustrates the reason why. A single year can be an outlier, an anomaly. It can severely distort the overall picture when comparing to a single year.

In the same article, David Madani of Capital Economics gets thrown under the bus for his history of incorrect predictions. He’s been predicting a 25% correction consistently for 30 months. If the Canadian market declines 25% from today’s prices, it will be pretty much back where it was when he started his forecasts. Now that Harold Camping has met his maker, perhaps Madani can take his place at the table.

It would appear that CREA is the voice of calm and reasonableness: “Canadian home sales have staged a bit of a recovery in recent months after having declined in the wake of tightened mortgage rules and lending guidelines last year,” said Gregory Klump, chief economist with CREA, who expects August results will also look strong as they are compared to a weak 2012.”

Accolades to First Foundation

When Madani first made his prediction in Feb 2011, it was rebutted by a mortgage broker who wrote, “people are not over-leveraged, that our incomes are sufficient to pay our obligations, and that the fundamentals are solid for a good, old fashioned, boring real estate market where reality overcomes emotion and conjecture.” It wasn’t sensationalist enough to attract any headlines, but it was accurate. Why David Madani is wrong

I’m not sure how a guy like Madani is able to keep his job in the light of such incorrect forecasts. On Capital Economics home page it states, “we have gained an enviable reputation for original and insightful research.” Good thing they don’t claim that it’s accurate.

Market update Jun 1 -11, 2013

According to the  Teranet – National Bank house price index for May which was released today, Calgary prices recorded a 2.3% month-over-month gain, while year-over-year, Calgary’s index was up 5.8%.(CREB data shows the y-o-y median price up 4.1%)

Inventory vs sales and price2

Garth Turner misleads his readers about Calgary

Do not read

Turner said on his GreaterFool.ca blog: It is different in Calgary. It’s worse. Year/year prices are up a startling 9%, but sales have just turned negative compared to last Spring. SFH sales are down 6%, and listings have crashed 22%…The nation’s most American city risks getting a wee taste of Vegas.

For someone who prides himself on accurate and up-to-date data, this is quite an astonishing deception which he’s trying to pull. How about using data from April? You know, current, updated, relevant numbers?  We know that Gartho has a bookmark to these latest numbers CREB statistics. Sales for the city of Calgary are actually up 14% compared to last year, and new listings have turned the corner this month and are up 13%. It’s no secret that sales have been low because inventory is down 30% compared to historical averages. There just hasn’t been anything to buy.

When you quote statistics that are outdated to prove your point, it makes one wonder if you have an agenda. As it is, GreaterFool.ca seems so intent on having Alberta join the ranks of falling markets in Toronto and Vancouver that he is willing to mislead his readers. Calgary’s stable market has been a source of severe irritation for Turner. Maybe he’s so blinded by his dislike of anything Calgary that he believes his own chicanery and deceptions.

Transparency? Let’s see how forthcoming he is about Calgary’s numbers at the end of the month when sales are up. I predict silence. The greater tragedy, however, is that most of his docile followers don’t even question him.

Why Calgary is different

graphMike Fotiou’s recent post has prompted me to offer a theory about the uniqueness of the Calgary real estate market. Calgary is the one and only city in Canada where the market has been relatively stable, with prices holding steady or increasing slightly this year. Over the past five years we’ve had small ups and downs, but the price has never fluctuated by more than 6.7% from year-to-year at the end of December.

Calgary is also the one and only city in Canada that’s had detailed and relevant housing statistics since 2006. Sellers and buyers have been able to make well-informed decisions about buying and selling based on the wealth of data that’s only been available here. Is there a correlation between good information and a stable housing market? Maybe.

My blog gave a balanced view with data and articles on all sides of the debate. While no one can predict the future, it enabled buyers and sellers to closely examine all sides of the issue, and think things through carefully before making decisions. In Feb 2007 I was the first realtor to publicly state that we could expect a correction, which did occur a few months later.

It all started with my website back in 2006 and Mike took it to a new level a couple years later. Consistent with the old saying that “a rising tide lifts all ships,” CREB started fine-tuning their statistics and now offer incredibly detailed and timely information. As Mike accurately states, “I don’t know of any other real estate board in Canada that provides such in depth real estate statistics and on a daily basis.”

Bubble bloggers hate accurate statistics

Bubble bloggers hate accurate statistics

The downside of being a leader also means being a target. I was the subject of many disparaging and malicious comments on the bubble blogs, most of which no longer exist.  The same people who complained about a lack of transparency were the first to ridicule and defame me for giving the straight goods, simply because it didn’t fit with their agenda of a big crash. None of the “crash-sites” were even remotely accurate in their  predictions for this market.

It’s pretty common to hear other blogs complaining about the information they get from the various real estate boards across Canada, with the exception of Calgary.

God’s Country

The following chart comes from Scotiabank. Read more Scotiabank Globalviews

Calgary and Edmonton were the only two cities to show an increase in sales in Sep 2012

Calgary has the best real estate statistics in Canada

There’s nothing more frustrating than trying to find good real estate data when you’re buying or selling, if it doesn’t exist. I received this email from a reader who realizes the value of relevant and timely information. If anyone reading can help this Ottawa resident, please leave a comment. It sounds like a great opportunity for Ottawa realtors to help inform their community:

“After moving to Ottawa I have spent significant amount of time and effort trying to find information on Ottawa RE stats. Other then very short and dry monthly bulletins on the OREB website and highly irregular and non-descriptive posts on the websites of the local Real Estate agents I couldn’t find anything even remotely similar to information provided on your website. I even emailed OREB asking them where I can find historical RE data, but it seems like they simply ignoring my requests so far. Is there a way for non-realtor to obtain current and historic stats from the local Real Estate Board? I realize that Ottawa Real Estate Board is out of your jurisdiction, but may be you can give an idea how I can get my hands on such information? Thank you for providing Calgarians with valuable RE information.”

Market update July 1-15

Although the mortgage rules changed on July 9, this past week(July 9- 15) would have been the period where a lot of the last-gasp deals were finalized and showed up on the books. The 30-day sales-to-new-listings ratio today is at 77%, the highest it’s been in July since 2005, but I wouldn’t read much into it.  I attribute it to the fact that a preoccupation with Stampede prevented people from listing their homes, while at the same time, a flurry of sales which were conceived 10-15 days ago were being finalized. I’d expect to see a lot of new listings in the coming weeks, with not so brisk a pace of sales. Compared to last year only, sales were up 37% this past week, while new listings were down 10%.

I’ve long maintained that average prices are a poor indicator of the housing market. Here’s a story that goes a little further  Average house prices don’t tell the whole story.

Sucking and blowing

Have you noticed something missing from the bubble blogs over the past few days? Conspicuous by its absence?

When sales are robust and prices are climbing, it’s a daily occurrence to hear that the real estate board’s stats are unreliable. An untrustworthy source of information. You know, cooking the books.

Now that sales and prices are declining( a normal occurrence in summer), we never hear mention of it. Suddenly, the real estate board’s numbers are infallible. Impeccable, trustworthy, and incapable of error.

Sucking and blowing, both at the same time.

******
It’s football season – again

Three times the mortgage rules have been tightened with little change in sales or prices in the Calgary market. Three times the blog dawgs were in a feeding frenzy for a few days. Three times they lined up to make the kick. Three times Lucy pulled the ball away.

For a fourth time, they’ve all lined up. What will be the result this time?

Go Stampeders!!(except when you play the ‘Riders 🙂 )

******
Examples of the trustworthy stats

A zealot from TheGreaterFool.ca, ironically with the name Questioning Calgary Stats left an anecdotal comment today: “Some comments on this blog provide examples of people who bought in Calgary in 2008, 2009, etc. and can only sell for a loss today.”

Let’s look at the facts. Over the past three days, 25 homes have sold which were puchased originally in 2008 – 2009. A total of 16 sold for more than the purchase price, or 64%. Not surprisingly, it appears that only the losers go to TheGreaterFool.ca.

******
Bidding wars update

Over the past three days, 11% of homes sold for list price or higher. A tear-down in Rideau Park sold in one day for $30,100 over list. Selling price was $880,000.