Category Archives: Calgary SFH

Market update July 31, 2013

Record sales in July

Update Aug 1: The Financial Post Magazine contacted me today regarding a story they’re doing about the real estate market across Canada. The reporter was asking  why Calgary was so different from other cities. I have my opinions which will eventually be published. What’s your take? (I had to chuckle when they asked about Garth Turner’s bad predictions for Calgary!)

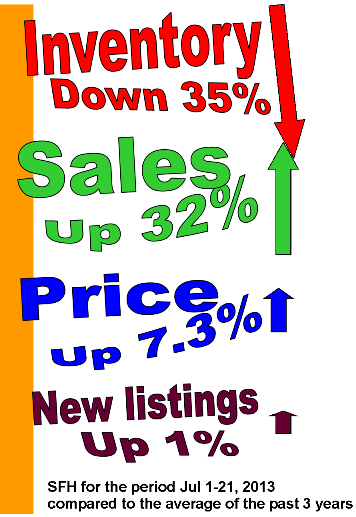
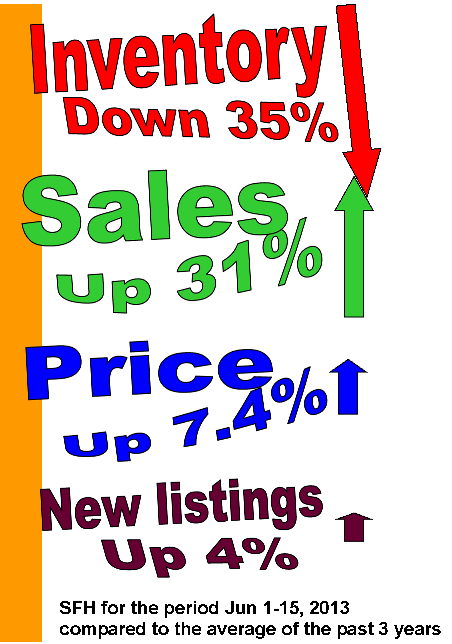
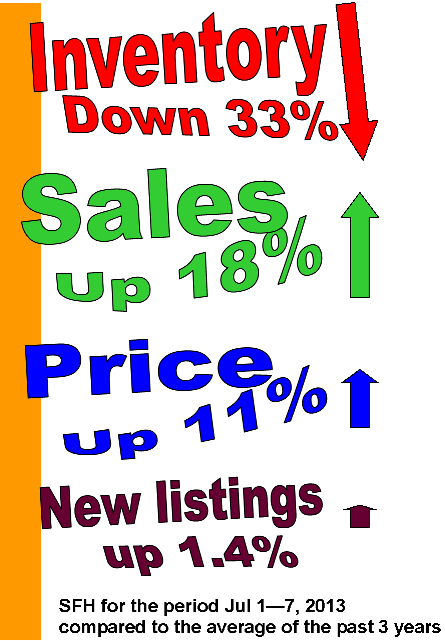
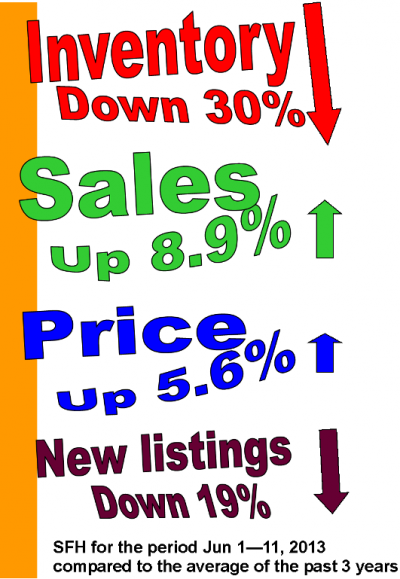
How do you achieve record sales when there’s almost nothing to buy? Inventory is at its lowest point since 2006, so you know that attractive new listings are going fast. As we learned from the craziness of 2006 – 2007, a runaway market is no fun for anyone except a few sellers who are moving to cities where the prices are low or dropping. Many homes are sold by the time a buyer comes to view them. Sellers can realize a quick sale, but if they are moving up or across town, they have all the headaches of looking for a new home with all the difficulties and turmoil of an over-heated market. We require lots more inventory before things will settle down, and there is no sign of that happening.

Inventory vs sales and price2

First-time buyers were up 39% compared to the average of the past 3 years.

The sales-to-new-listings ratio at 80% is the highest it’s been since 2005. Homes under $500,000 are in huge demand, with an absorption rate of 1.1 in July. That is an entrenched seller’s market. Over the last four days of July, 15% of sales were for list price or higher. As Brad stated in his recent comment, Garth Turner looks very foolish for his dire predictions of a nosedive in Calgary’s sales. Be careful who you listen to.

Image

Market update Jul 1 – 21, 2013

Inventory vs sales and price2

Is demand outstripping supply?

Lester asks “How does this compare in terms of statistics to the frenzied days of 2006? It seems demand is rapidly outstripping supply. Are the number of proprties, dom, absorption similar?”

Comparing July 2006 to today, the scariest number is SNL(sales-to-new-listings ratio). It’s at 80% right now, whereas in 2006 it was 52%. Also of concern this year: sales are slightly higher, and new listings are a lot lower. The trend is definitely more demand, less supply. The early months of 2006 were the craziest and it cooled down starting in July. This year, it seems to be getting hotter(and not just the weather!).

Luckily, we have 50% higher inventory, but at 3100 listings, that’s still considered very low. DOM is a lot higher than in 2006. It took, on average, 18 days to sell a house in 2006, today it’s 35 days.

The absorption rate today is 2.0 but was lower in 2006 at 1.5. That means we had a 45-day supply of homes for sale in 2006, and today we have 60. Both those numbers are very low and of concern.

All things considered, the situation does not bode well for buyers.

Sellers have the upper hand in Calgary

Over the past four days, 14% of sales have been for list price or higher. For a healthy market, that’s still higher than I’d like to see it.

A 1990 sq ft 2-storey home in Citadel which was listed for $434,900 was sold for $445,000. It was only on the market for two days.

More indicative of the market is the sales-to-new-listings(SNL) ratio at 80%. The average SNL in July since 2006 has been 59%.

The absorption rate of 2.0 is also in seller’s market territory. This means we have a 60-days supply of listings. We normally have a 102-day supply in July.

I don’t normally pay much attention on this blog to the condo market, but the SNL ratio for condos in July is a phenomenal 95%. It’s usually at 59% in July.

Image

Market update Jul 1 – 15, 2013

Inventory vs sales and price2

Bloodbath postponed for five years

“House-aggeddon” was supposed to have happened every year between 2008 – 2011.  No luck.

After the mortgage rule changes, a devastating crash was predicted for 2012. No luck.

A crash of biblical proportions was forecast for 2013. That one’s gone by the wayside.

Now its been delayed for another five years according to this gem from GreaterFool.ca: . “If so many people are rushing to lock-in pre-approved mortgage rates while home prices are still high, how bad is it going to be in 2018 when the rates are closer to 10%??? Its going to be a bloodbath!”

Image

Market update July 1 -7, 2013

Inventory vs sales and price2

Market update Jun 1 – 18, 2013

To quote Ben Rabidoux, “Hard to see how Alberta’s housing market will slow meaningfully given population growth + low units under constrctn.”

Inventory vs sales and price2Rabidoux: “Alberta nominal y/y population growth in Q2 2013 was HIGHER than Ontario for the first time….ever.”

 Here’s a chart from Rabidoux showing population growth:

Population change

Calgary house price growth best in Canada

Last month I made a special note of the fact that first-time buyers were busy in May, with a 30% increase in first-timers over last year. This story in the Herald reinforces it:

The real estate market in Calgary is supported by three important factors,  any of which would support a robust market independently and yet we enjoy all  three,” said Cody Battershill, a realtor with RE/MAX House of Real Estate in  Calgary. “The underlying variable that ties all three together is the  desirability and quality of living we enjoy in Calgary.”

The first factor is strong migration to Calgary and Alberta.

“The second is Calgary’s demographics. We are Canada’s youngest major city  with the average Calgarian being in their mid to late 30’s. This is important as  first-time buyers kick start the property ladder and enable existing homeowners  to sell and move up,” he said.

“The third factor is that Calgary is a head office leader and business hub  that is recognized internationally for our experience, technical prowess and  leadership. Calgary has more head offices per capita than anywhere else in  Canada and is the world’s 17th most competitive financial centre.”

Read more:  House price growth best in Canada

also, from BMO: Prices remain stable, perhaps maddeningly so for the legions of bubble mongers. The ceiling can’t hold us

Yesterday’s re-lists

If you’re not familiar with the term, re-listing refers to the practice of terminating a listing and re-listing it soon after in order to have the days-on-market reset to zero, and perhaps give the impression that it’s a fresh, new listing.

There were 96 new listings yesterday, of which 11 were re-lists. The criteria I’m using covers anything that terminated or expired since March 14.

What’s interesting is that most of them, 9 of the 11, were in the upper price ranges(an original list price above $700,000). Also, 2 of the 11 were re-listed at the same price. Sometimes a listing expires at the end of 60 or 90 days and the sellers simply re-list in order to keep their property on the market, frequently at the same price.

Why is this important information? If you’re looking at buying, it’s vital to know the history of the listing as it will give you some insight that can be used when considering your offer.

I can’t stress enough the importance of sellers pricing their property correctly. If your house sits on the market for longer than average, it becomes stale and you’ll usually end up selling for less than if you had priced it correctly for a quick sale in the first place.

Market update Jun 1 -11, 2013

According to the  Teranet – National Bank house price index for May which was released today, Calgary prices recorded a 2.3% month-over-month gain, while year-over-year, Calgary’s index was up 5.8%.(CREB data shows the y-o-y median price up 4.1%)

Inventory vs sales and price2